


アプリケーションノート (分析目的)- Applications for Reseach, Development and Process Analysis -
Topics
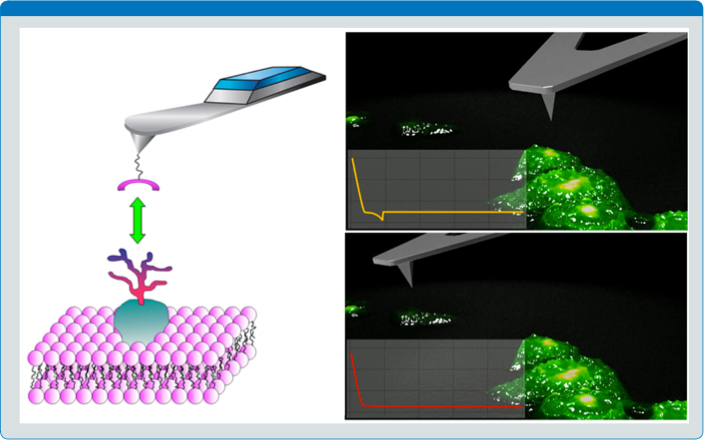
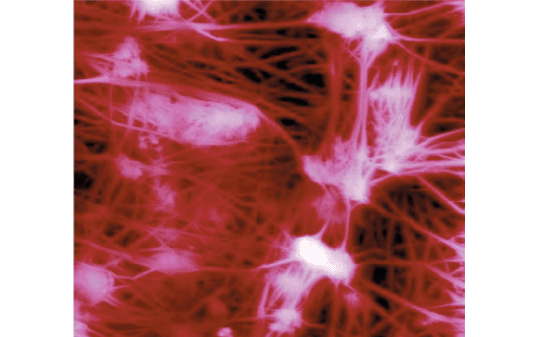
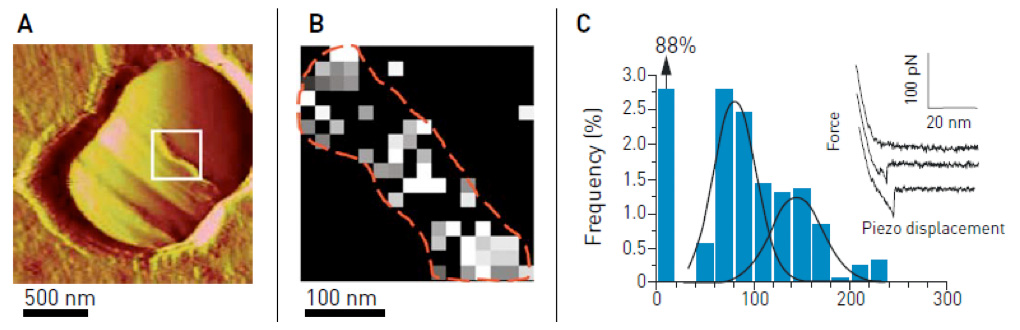
Correlation between fluorescence intensity and specific AFM force measurements on living Hela cells. A tip was functionalized with a toxin able to target any inositol-containing molecule. Fluorescent cells over-express GPI-anchored proteins and exhibit a high number of specific unbinding events (yellow retraction curve) whereas for most of the non-fluorescent cells, no event (red retraction curve), or a much lower number, can be detected.
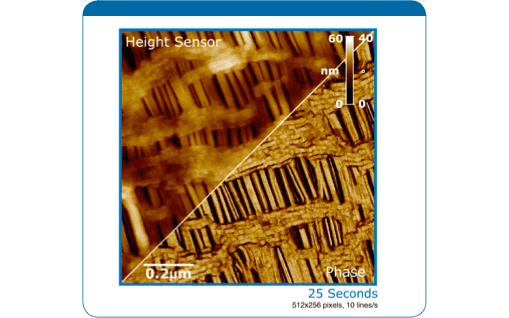
Celgard® oriented Polypropylene membrane (TappingMode, Broadband-A Probe) is a good indicator of AFM force control. Tracking error would cause lateral forces to separate and damage the smaller strands.
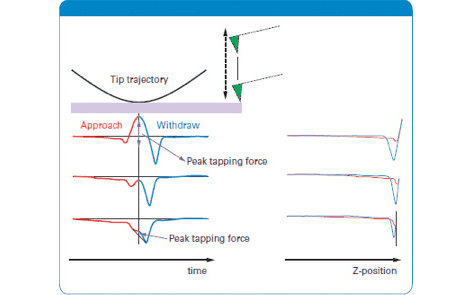
Experimental data of force curves for a cantilever operated in PeakForce Tapping. The lever is driven by a sinusoidal wave and the curves are displayed as force versus time and force versus distance.
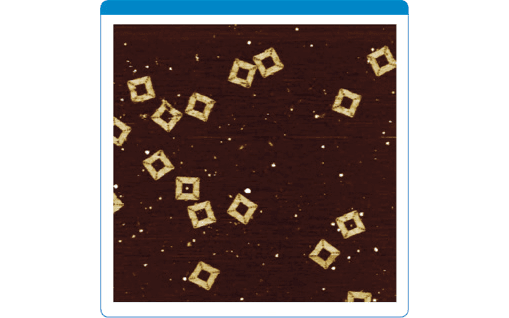
1μm scan of Origami DNA in buffer solution using ScanAsyst.
材料
①半導体
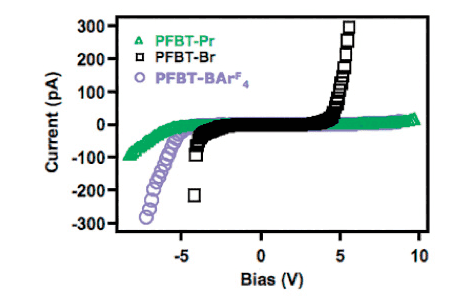
Average I-V curves of the three polymer films
②データストレージ
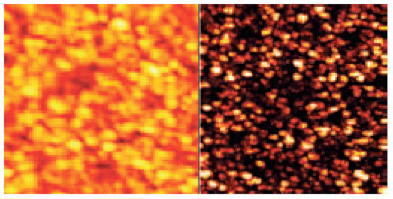
Topography (left) and tunneling current (right) images taken on a 1.2nm thin aluminum oxide (Al2O3) film at a sample bias voltage of 0.14V. 500nm scans, 5 pA current range. Data courtesy A. Olbrich, Infineon, Munich, Germany.
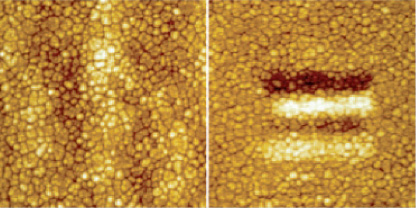
Topography (left) and FM-EFM (right) images of a ferroelectric film with electrical bits written onto it.
③電池
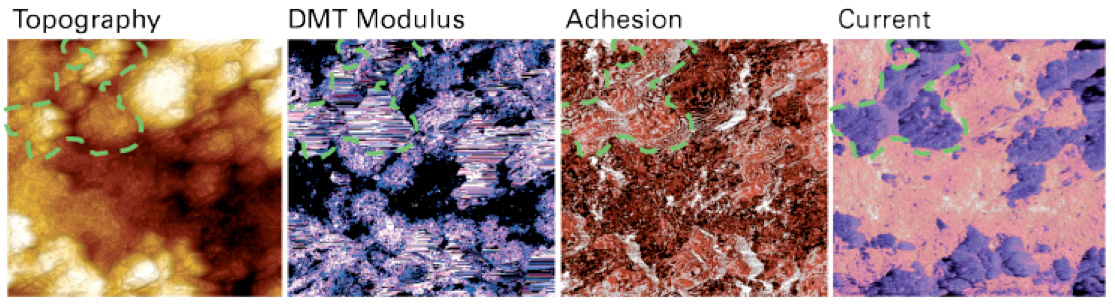
PF-TUNA images of a Li[Ni1/3Mn1/3Co1/3]O2 composite cathode. Sample courtesy of Dr. Zheng and Battaglia, Lawrence Berkeley National Laboratory.
④ポリマー
30μm scan of a Teflon membrane in PeakForce Tapping
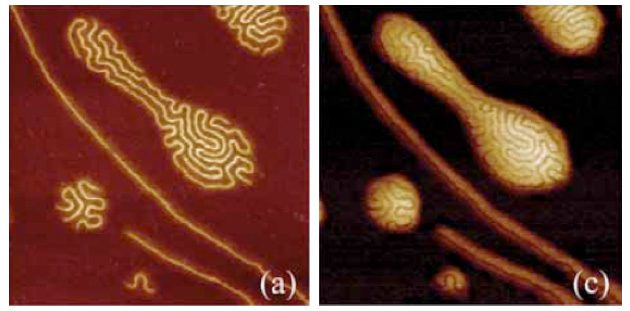
Poly(butyl acrylate) brush-like macromolecules(a) Height,(c) Adhesion
⑤バイオ
Correlation between fluorescence intensity and specific AFM force measurements on living Hela cells. A tip was functionalized with a toxin able to target any inositol-containing molecule. Fluorescent cells over-express GPI-anchored proteins and exhibit a high number of specific unbinding events (yellow retraction curve) whereas for most of the non-fluorescent cells, no event (red retraction curve), or a much lower number, can be detected.
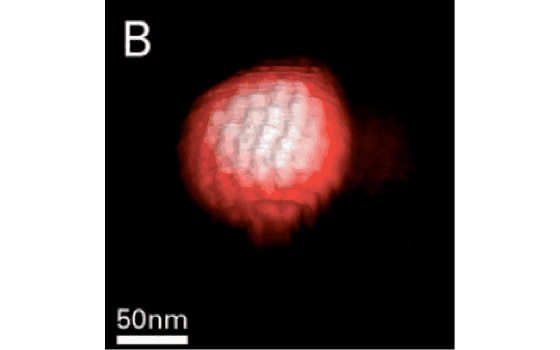
A 250nm AFM Topography image of a single herpes simplex virus capsid. Sample courtesy of Wouter Roos and Gijs Wuite, Vrije Universiteit, Amsterdam, Netherlands.
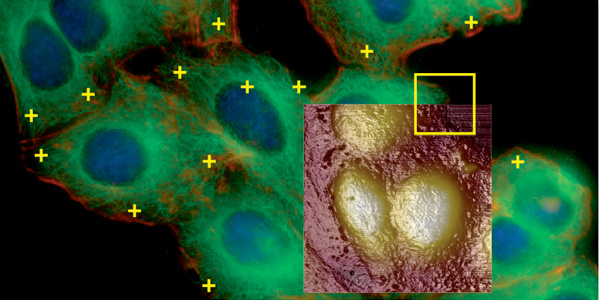
In the MIRO canvas, the fluorescence image is used as a background to target AFM measurements.
⑥その他
アプリケーション
①構造(凹凸像)
※構造(凹凸像)に関する全てのアプリケーションノートはここをクリック
Correlation between fluorescence intensity and specific AFM force measurements on living Hela cells. A tip was functionalized with a toxin able to target any inositol-containing molecule. Fluorescent cells over-express GPI-anchored proteins and exhibit a high number of specific unbinding events (yellow retraction curve) whereas for most of the non-fluorescent cells, no event (red retraction curve), or a much lower number, can be detected.
Celgard® oriented Polypropylene membrane (TappingMode, Broadband-A Probe) is a good indicator of AFM force control. Tracking error would cause lateral forces to separate and damage the smaller strands.
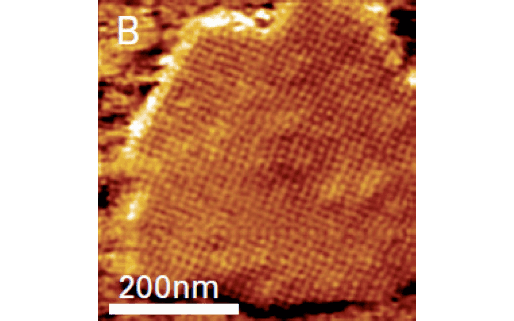
AFM phase image of bacterial S-layers from E. coli. Sample courtesy of Hans Oberleithner, Institute for Physiology II, University of Muenster, Germany
②機械特性
Correlation between fluorescence intensity and specific AFM force measurements on living Hela cells. A tip was functionalized with a toxin able to target any inositol-containing molecule. Fluorescent cells over-express GPI-anchored proteins and exhibit a high number of specific unbinding events (yellow retraction curve) whereas for most of the non-fluorescent cells, no event (red retraction curve), or a much lower number, can be detected.
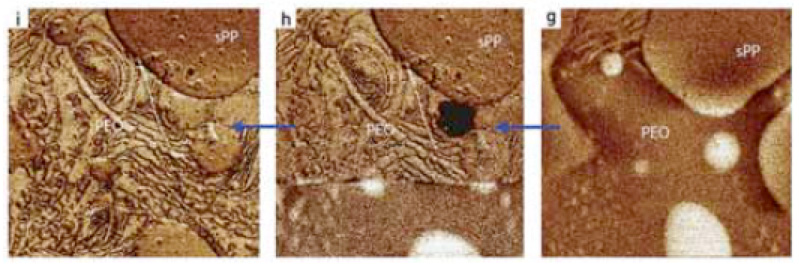
Cooling of polymer blend of syndiotactic polypropylene and polyethylene oxide. g-i show the modulus.
③電気特性
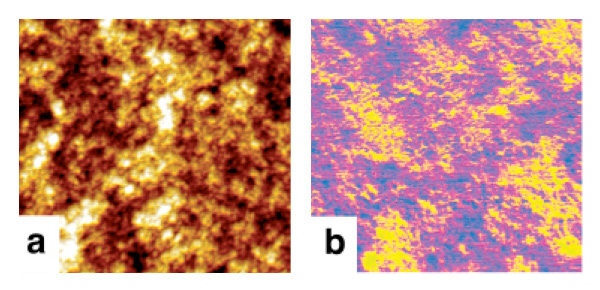
PeakForce TUNA images of P3HT:PCBM solar cell with a PEDOT modified ITO/glass anode. Shown are (a) topography, scale 10nm;(b) Cycle-averaged Current, scale 5pA.
④相互作用
Correlation between fluorescence intensity and specific AFM force measurements on living Hela cells. A tip was functionalized with a toxin able to target any inositol-containing molecule. Fluorescent cells over-express GPI-anchored proteins and exhibit a high number of specific unbinding events (yellow retraction curve) whereas for most of the non-fluorescent cells, no event (red retraction curve), or a much lower number, can be detected.
Imaging and probing of D-Ala-D-Ala sites on living bacteria.